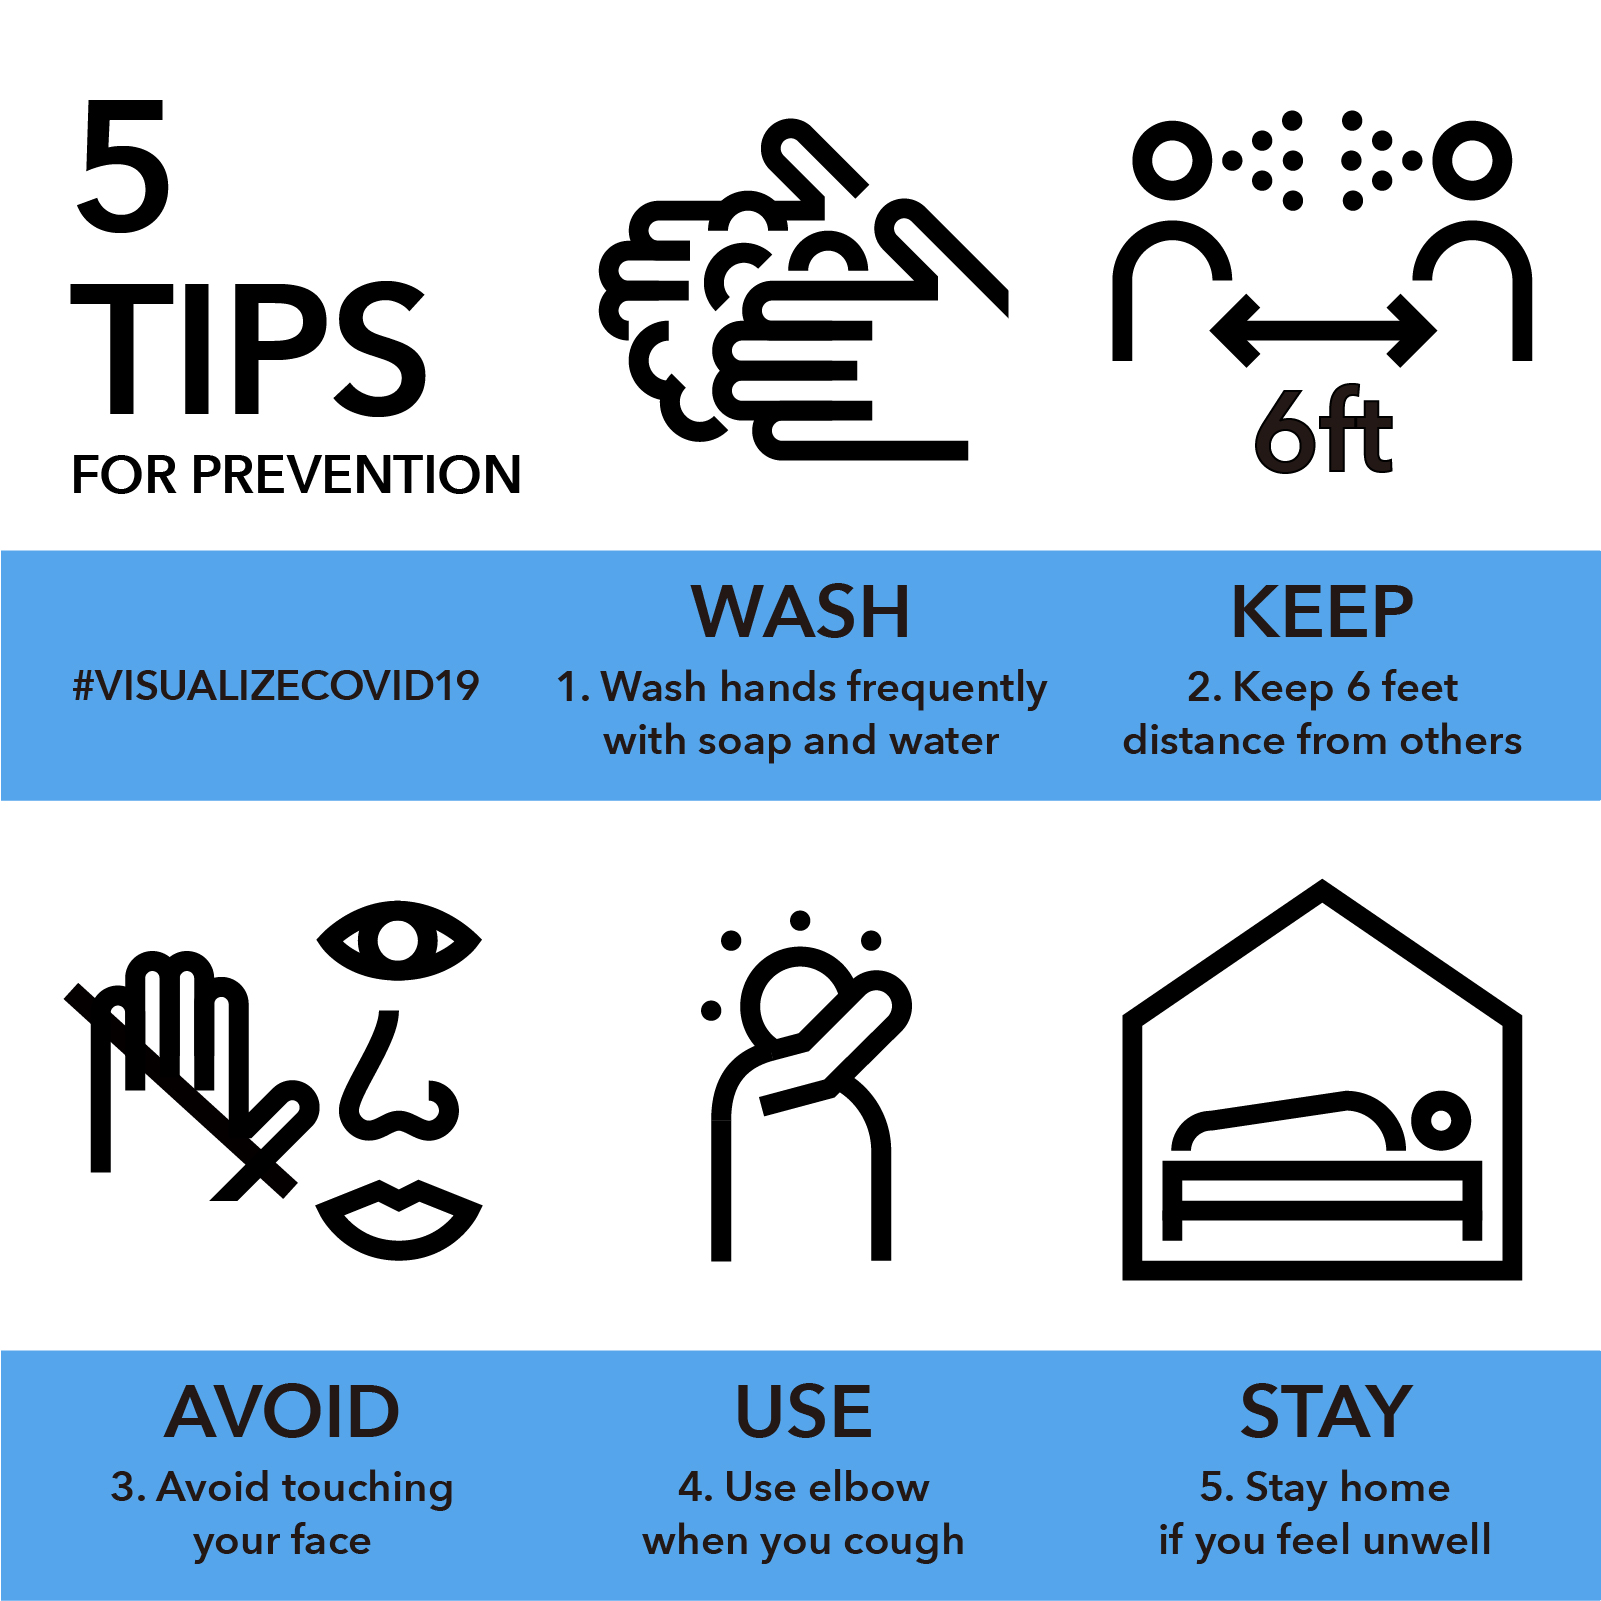
PICTOGRAM 2: Prevention Tips (2020.03.30)
Coronavirus infection rates have gone up during the weekend, and America currently has the highest number of infections with more than 120,000 people infected and 2100 people deceased (according to WHO 3/30/2020). We visualized the five basic principles of infection prevention. Our individual understanding and actions will be the keys to creating a bigger change. Stay healthy! *We reference WHO for information, but for social distancing guidelines we use 6ft as dictated by CDC.
PICTOGRAM 2: 感染予防の基本項目 (2020.03.30)
この週末もコロナウィルスの感染者数は増え続け、アメリカの感染者は12万人強で世界一となり、亡くなられた方は2100人以上にのぼっています( 参照:WHO 3.30.2020)。改めて感染予防の基本項目5つをまとめてみました。個人単位の自覚と行動の積み重ねが、きっと大きな変化に繋がると信じています!Stay healthy! ※WHOの情報を参考していますが、人との距離についてはCDCの定めた基準6ftを使用しています。
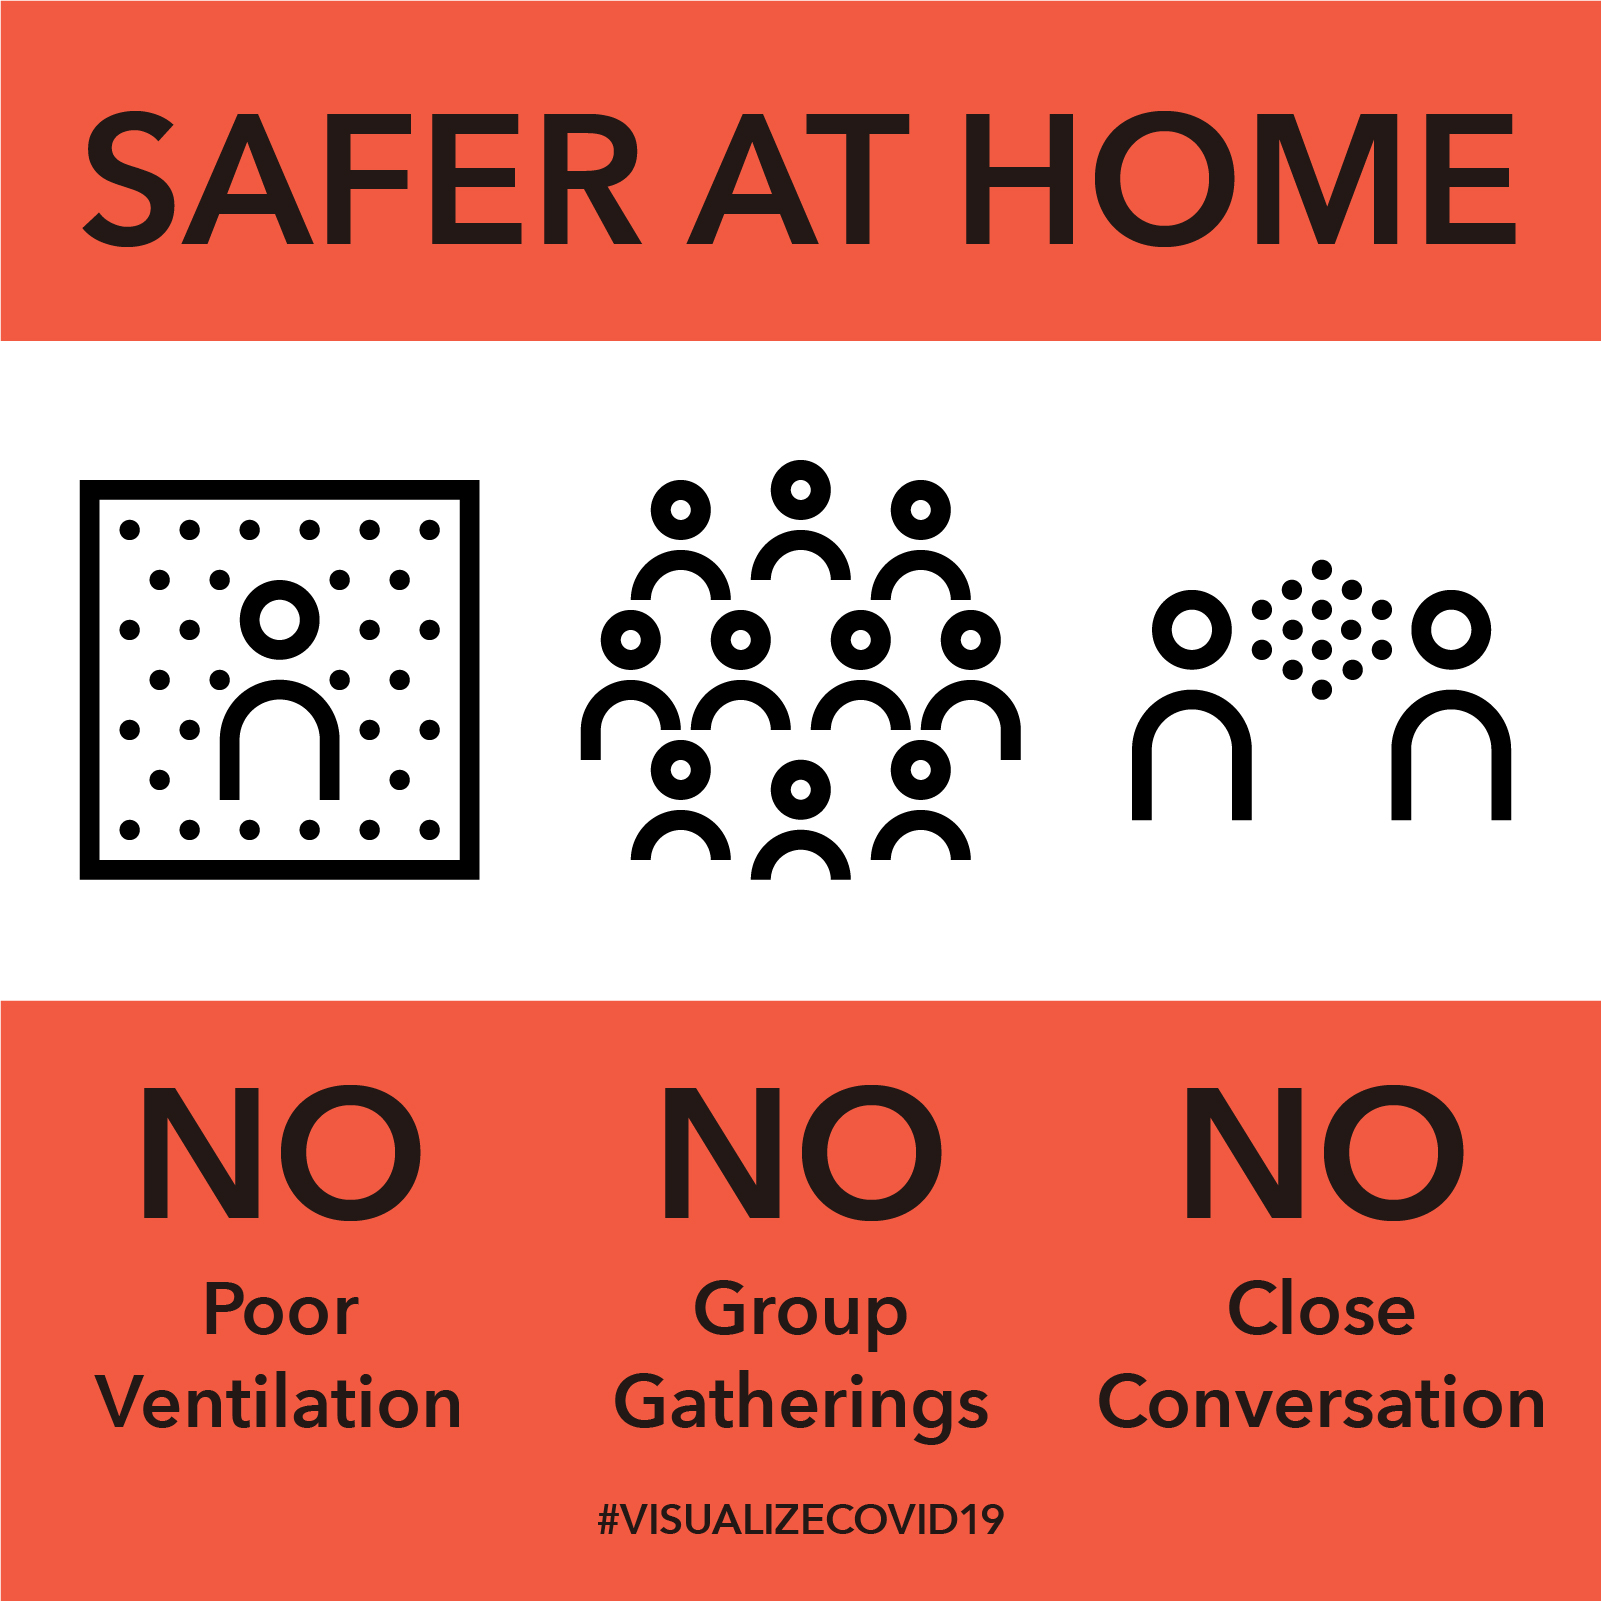
PICTOGRAM 1: Places to avoid (2020.03.27)
Tokyo has released a stay at home request this weekend to prevent the spread of COVID 19. The government warns to avoid “closed spaces with poor ventilation” “group gatherings” and “close conversation”. Globally, stay at home requests are being issued with varying severity, and each person is expected to act responsibly. We will share this graphic in Japanese and English so it can reach expats living in Japan. Have a good weekend!
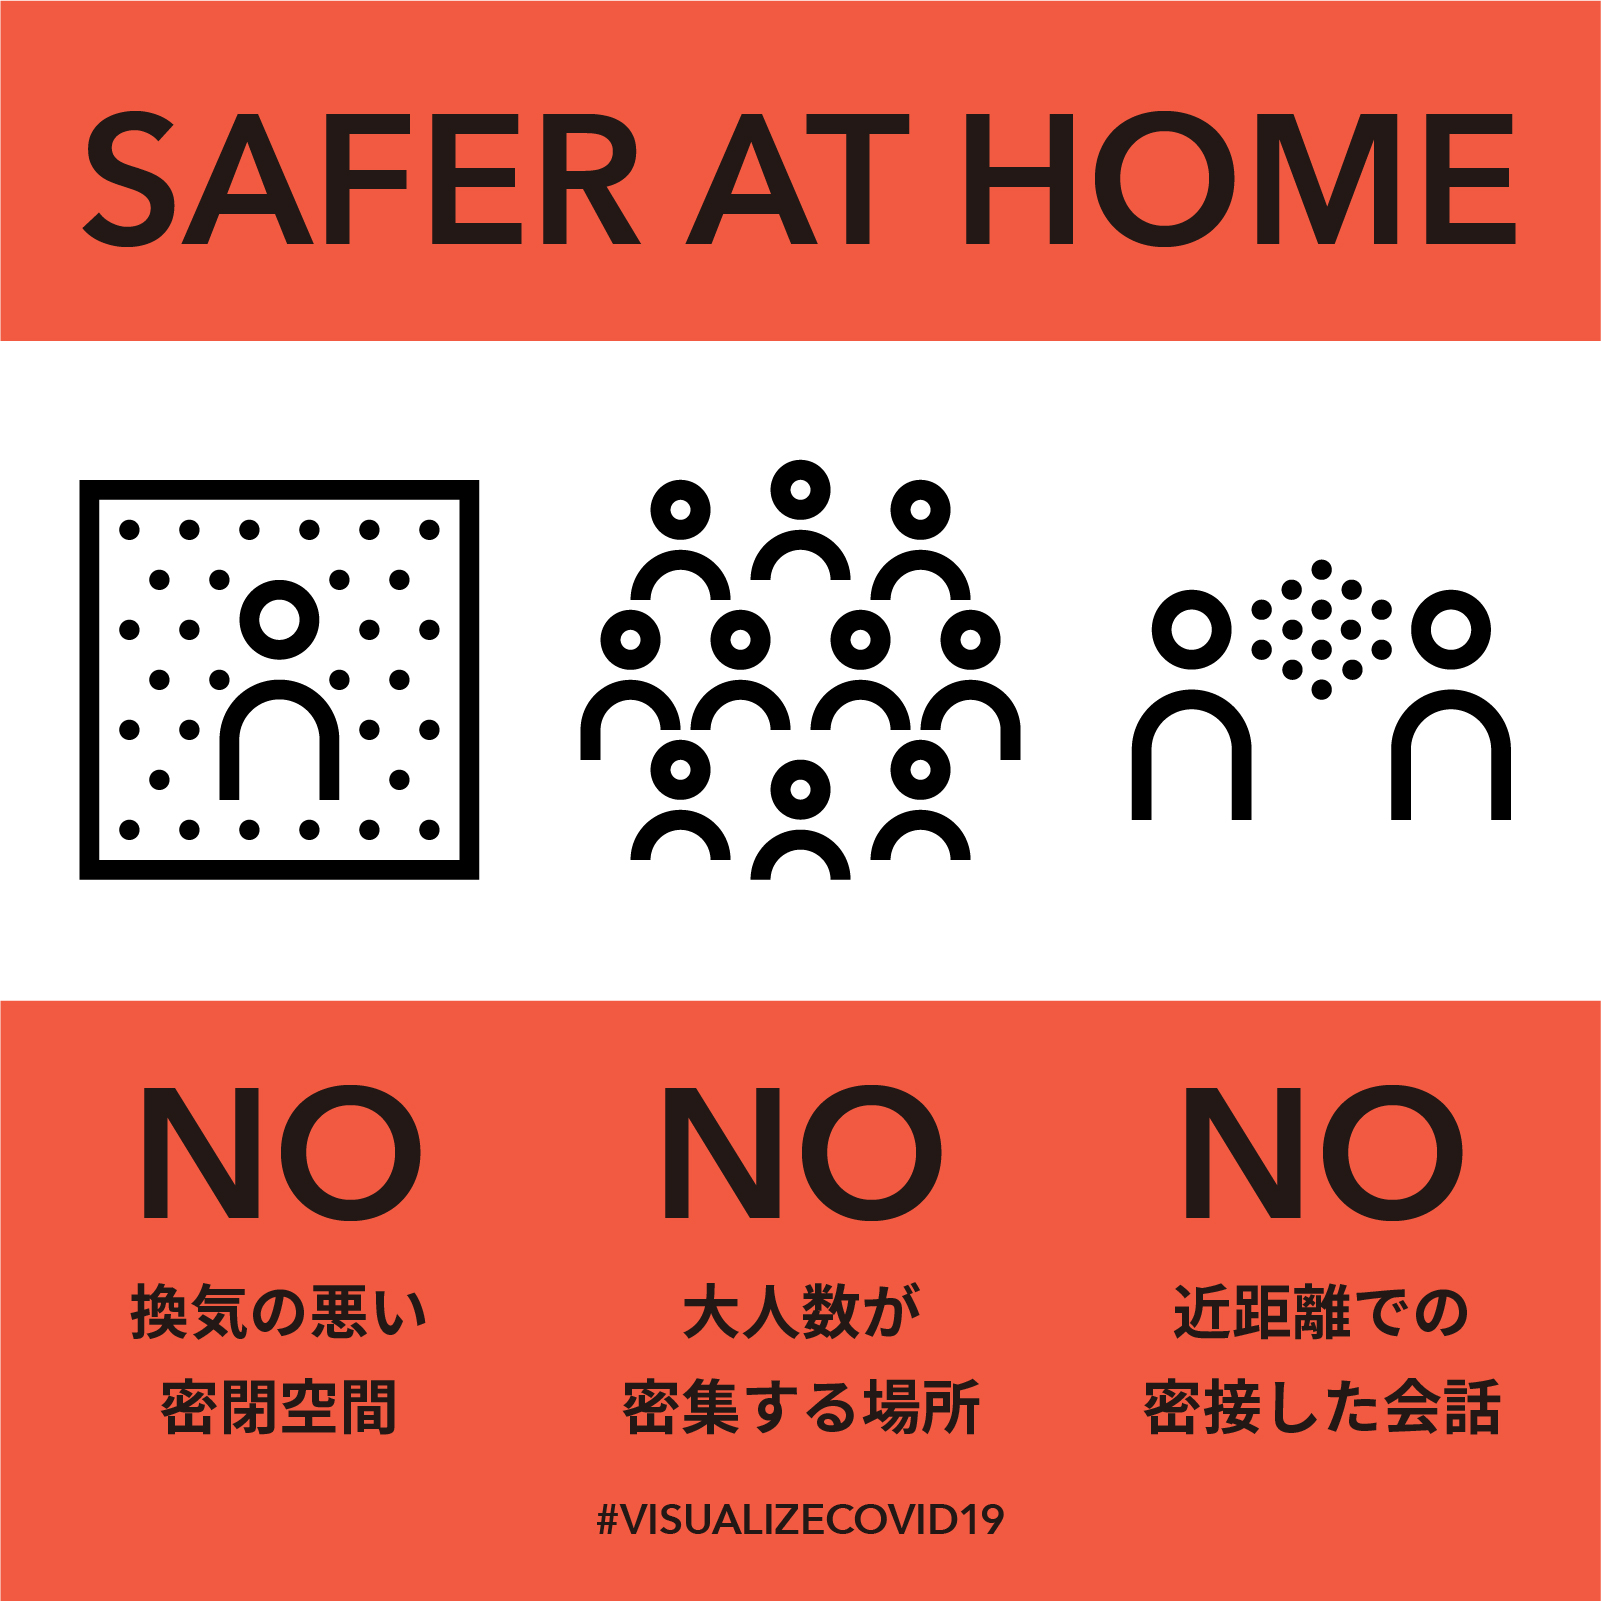
PICTOGRAM 1: 三密 (2020.03.27)
東京都は3/25にコロナウィルスの感染拡大を防ぐため、週末の外出自粛要請を出しました。 「換気の悪い密閉空間」「多くの人の密集する場所」「近距離の密接した会話」という「三つの密」を避けるようにとのこと。現在世界中で外出規制が行われており、ひとりひとりの自覚が求められています。東京にお住いの外国人の方にも分かるように、英語と日本語で注意喚起のヴィジュアルをシェアします。皆様よい週末を!
THINK NEW NORMAL 1 (2020.06.12)
The COVID19 experience demands a shift in perspectives. “THINK NEW NORMAL” is a series that looks into the future of normalcy in time spent at work, with family, and in daily life. The motion is created by @newtral1 . The first video is about a safer workplace. Remote work and staggered attendance allows for a safer and more productive workplace. Cooperation by: Kenichi Hashimoto Production Office
THINK NEW NORMAL 1 (2020.06.12)
COVID19の経験によって思考の方向転換が求められています。“THINK NEW NORMAL”と題して、生活、仕事、家族、時間など、未来の普通について考えてみたいと思っています。映像制作は @newtral1 が協力してくれました。最初は、より安全な仕事環境について。 生産性、安全性を保つ仕事環境として、交互出社やリモートワークの有効性を表現しています。 制作協力:橋本健一制作事務所
VISUALIZATION 3: Exponential Infection (2020.04.14)
In the US, there are now over 22000 deaths by COVID-19 (as of 4/13). The branching motion shows how explosive contagion occurs. If we each go to 1 potentially infectious gathering, the infection rate can be exponential. If we each stay at home and avoid gatherings, we can contain this explosive pace. In order to prevent medical breakdown, let’s all be responsible for our own actions.
VISUALIZATION 3: 感染拡大 (2020.04.14)
アメリカではCOVID19が依然猛威を振るっており、亡くなられた方は22000人を超えました(4.13現在)。枝分かれして広がっていくこの動きは、感染者の爆発的な増加(オーバーシュート)の仕組みを表しています。感染は等比級数的な広がりを引き起こしますが、ひとりひとりが接触を避ける努力をすることでこの爆発的な広がりは抑えられます。医療現場の崩壊を防ぐためにも、今一度自分の行動に責任を持ちましょう。
VISUALIZATION 2: 6 feet apart (2020.04.03)
Corona virus infection rates have gone up during the weekend, and America currently has the highest number of infections with more than 120,000 people infected and 2100 people deceased (according to WHO 3/30/2020). We visualized the five basic principles of infection prevention. Our individual understanding and actions will be the keys to creating a bigger change. Stay healthy!
VISUALIZATION 2: 6 ft 離れる (2020.04.03)
この週末もコロナウィルスの感染者数は増え続け、アメリカの感染者は12万人強で世界一となり、亡くなられた方は2100人以上にのぼっています。(data resource: WHO 3.30.2020) すでにご存知の情報だとは思いますが、改めて感染予防の基本項目5つをまとめてみました。個人単位の自覚と行動の積み重ねが、きっと大きな変化に繋がると信じています!Stay healthy! ※制作にあたってはWHOの情報を参考にしていますが、人との距離については、CDCの定めた基準6ftを使用しています。
VISUALIZATION 1: Social Distancing (2020. 03. 26)
Social distancing is currently the key to reducing and preventing overshoot. By practicing a safe distance with others, we can each drastically reduce infection risk. Please keep your distance for now. We sincerely pray that people worldwide would be able to get back to business as usual as swiftly as possible.
VISUALIZATION 1: ソーシャルディスタンス (2020. 03. 26)
爆発的な感染拡大を防ぐために、今一番意識しておく必要のあるSocial Distancing。人と距離をおくことで、感染リスクは一気に下がります。とにかく今は人との接触をできる限り避けましょう。1日も早く普段の生活が取り戻せることを願っています
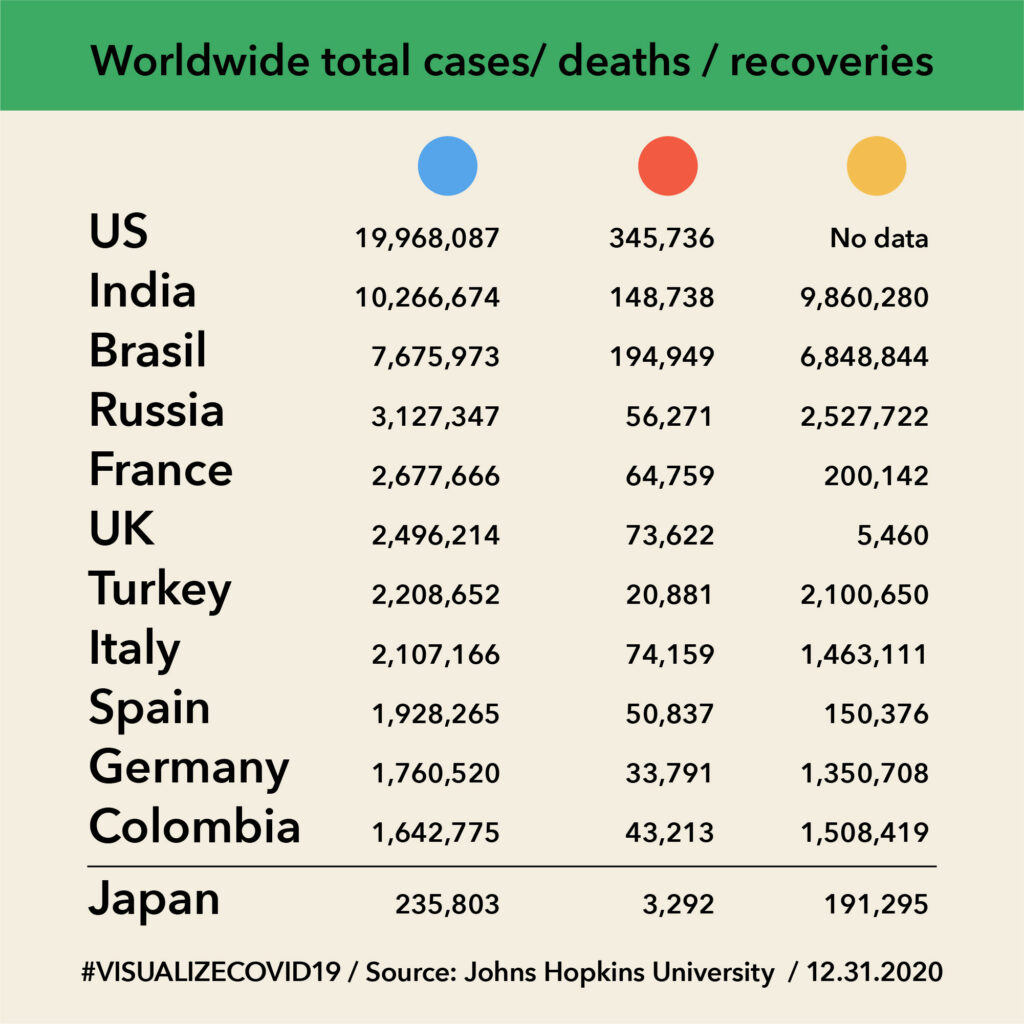
CURRENT STATS (2020.12.31)
現状のグラフ (2020.12.31)
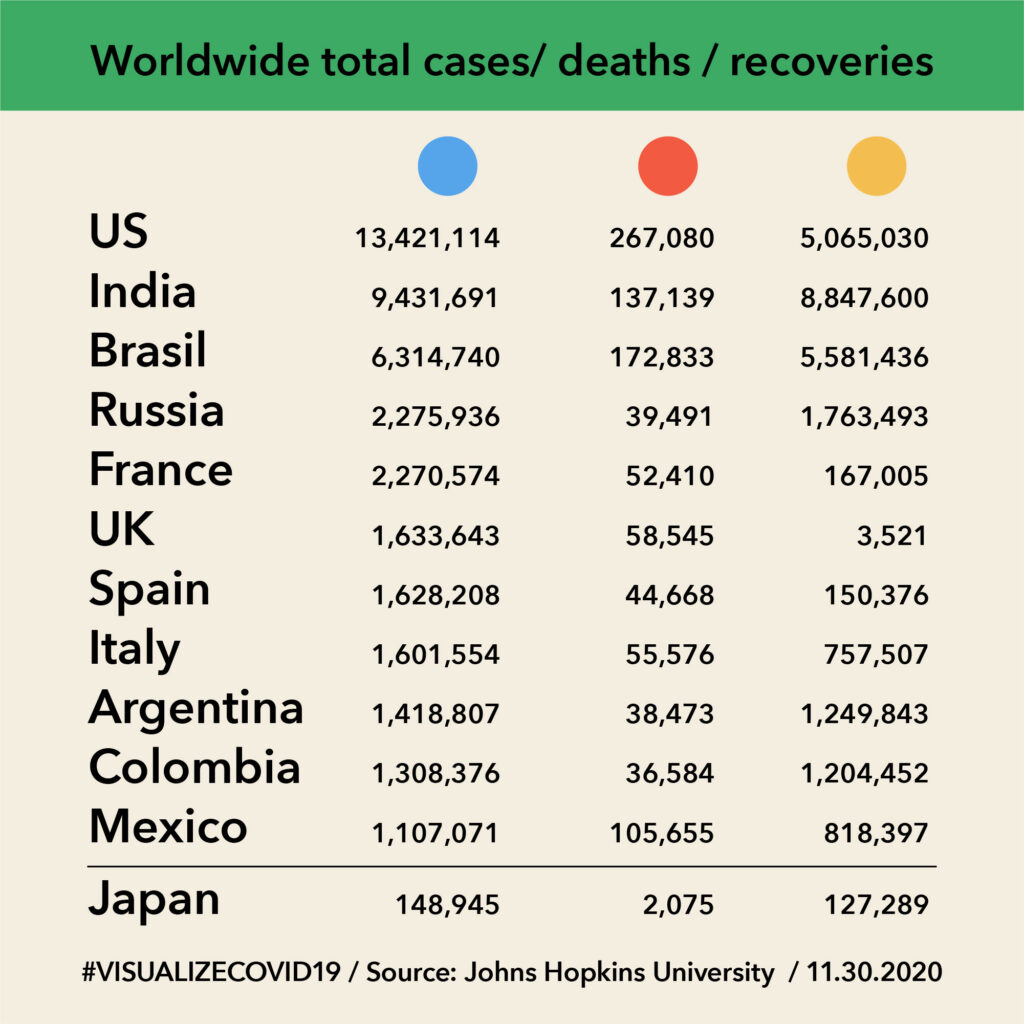
CURRENT STATS (2020.11.30)
現状のグラフ (2020.11.30)
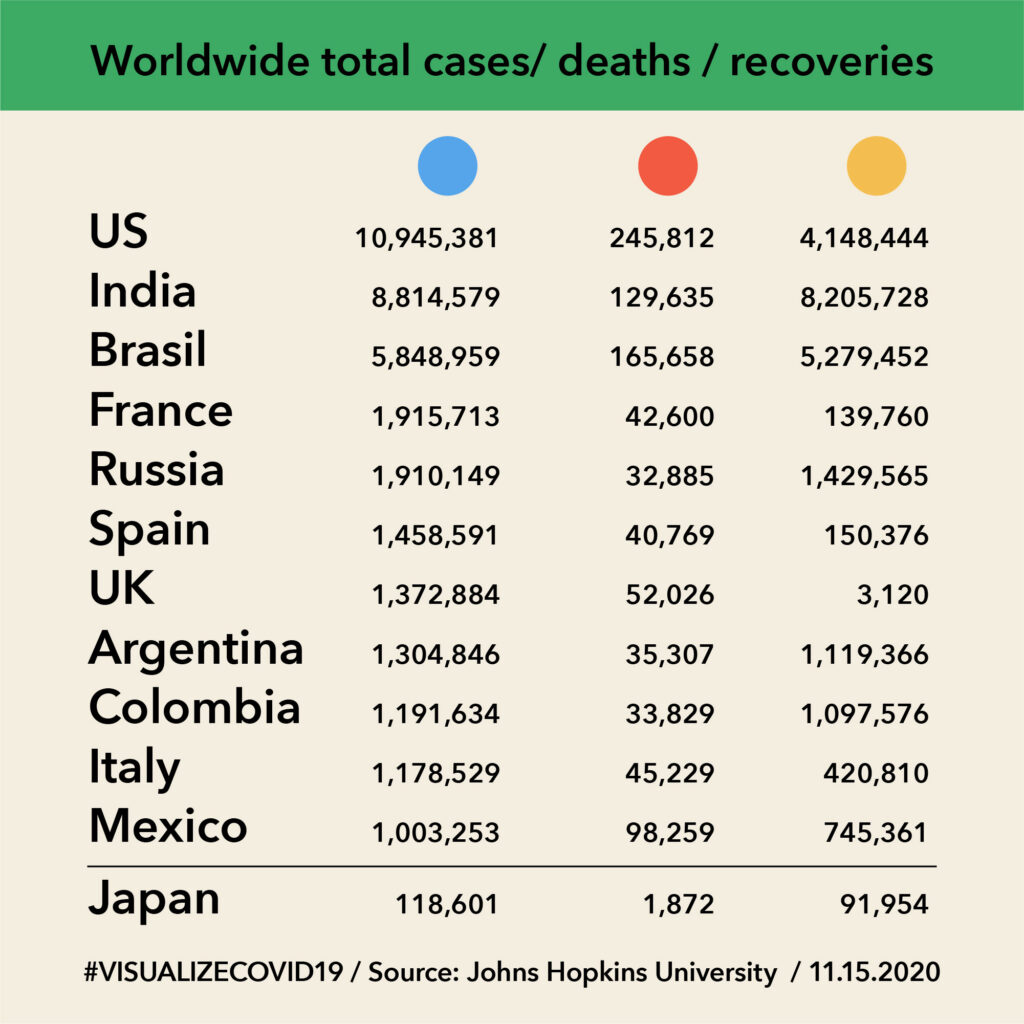
CURRENT STATS (2020.11.15)
現状のグラフ (2020.11.15)
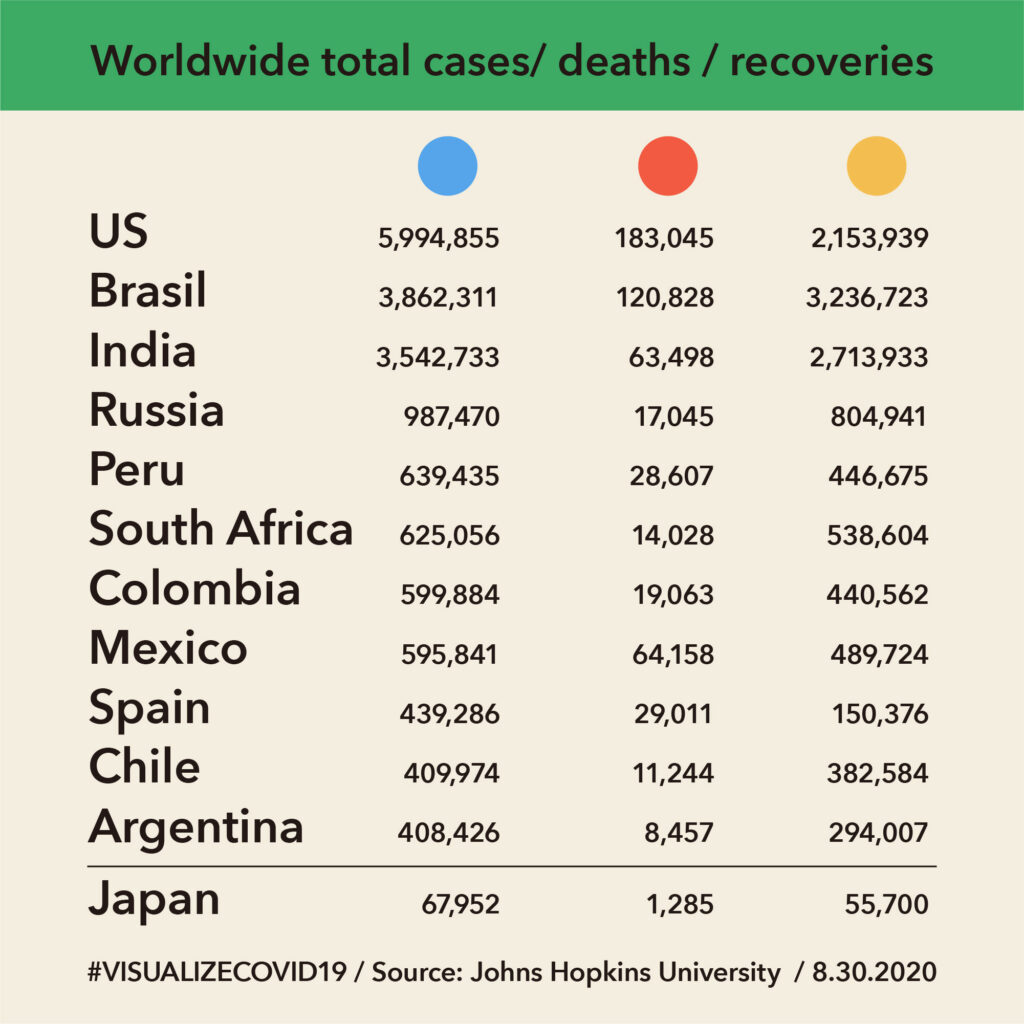
CURRENT STATS (2020.08.30)
現状のグラフ (2020.08.30)
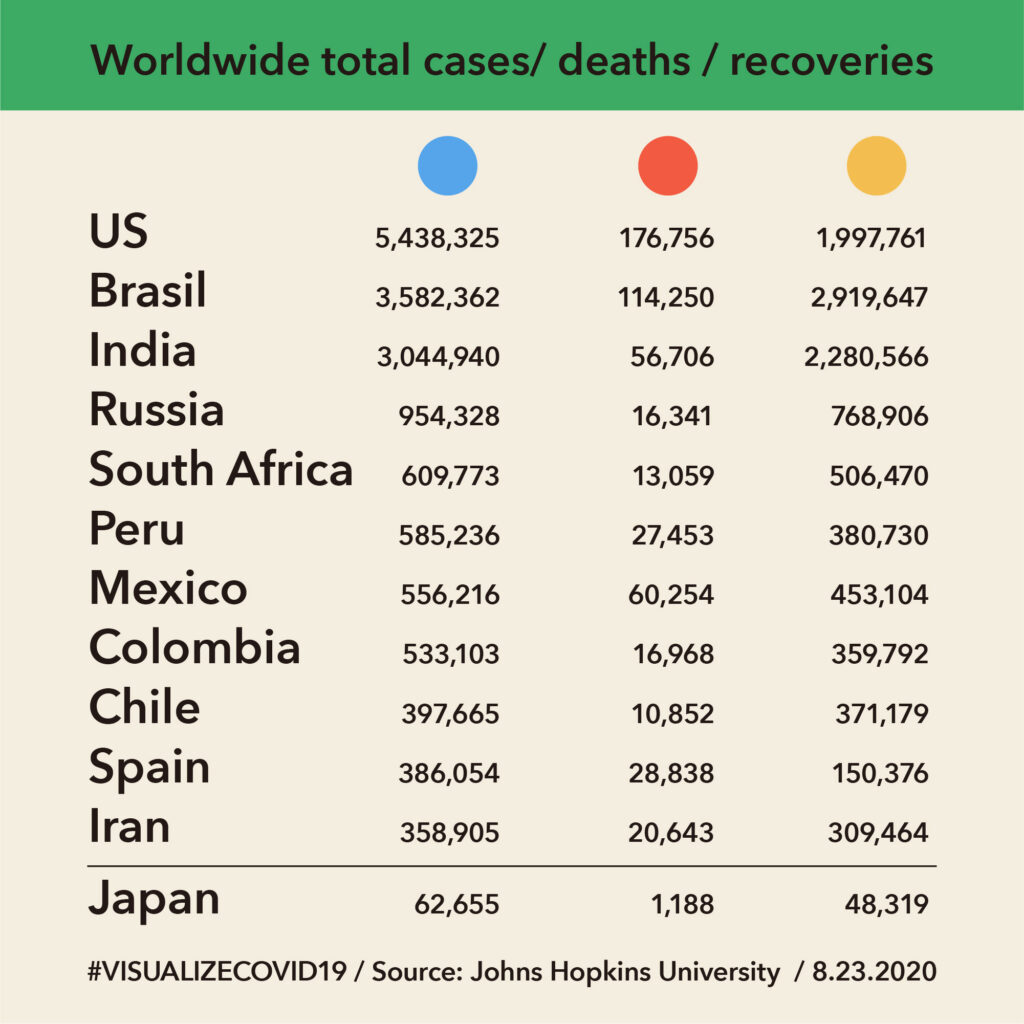
CURRENT STATS (2020.08.23)
現状のグラフ (2020.08.23)
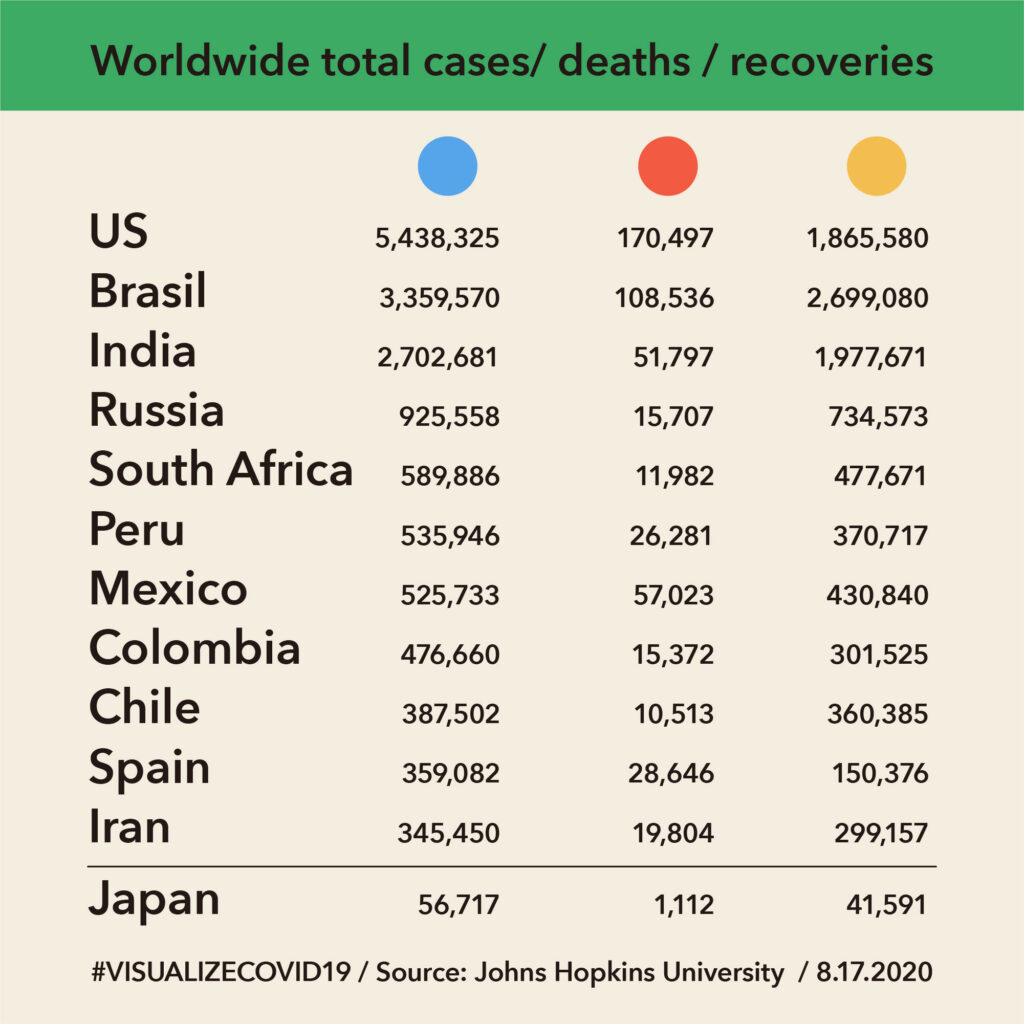
CURRENT STATS (2020.08.17)
現状のグラフ (2020.08.17)
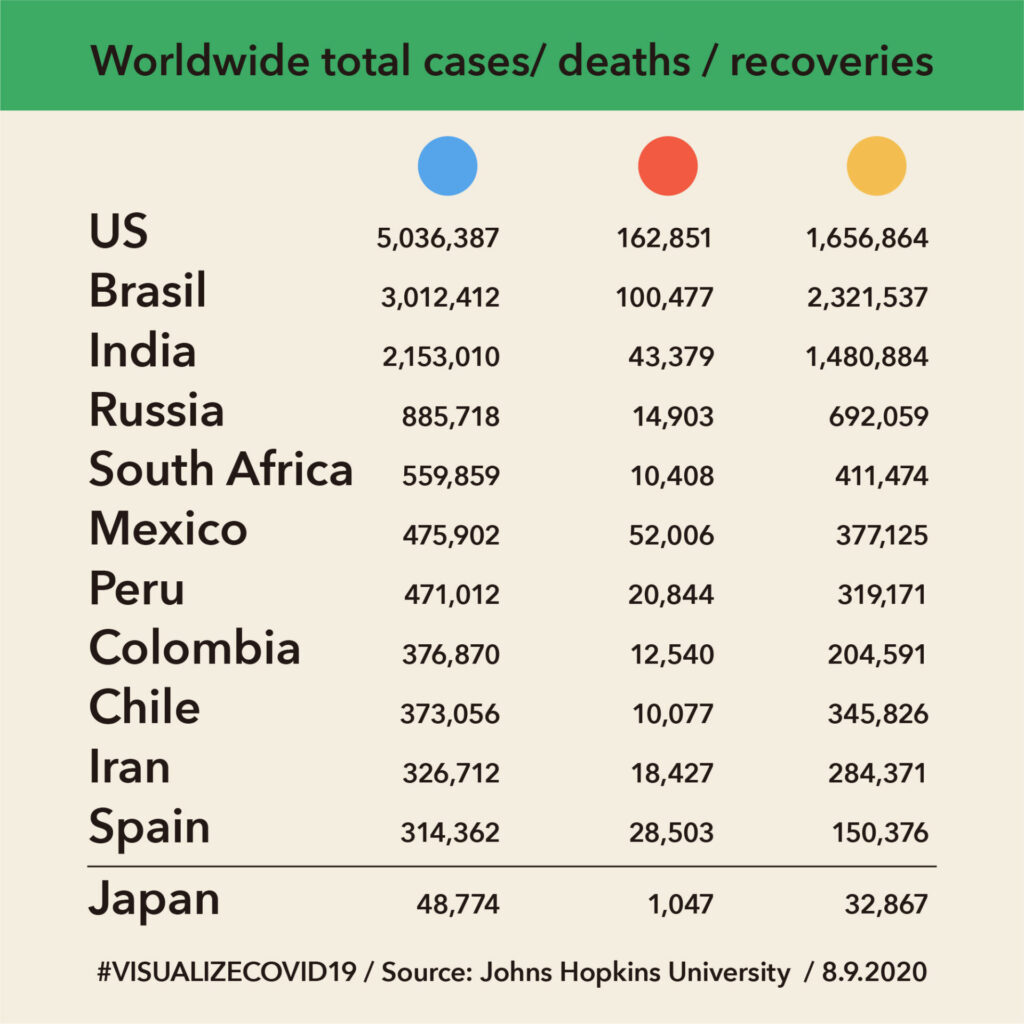
CURRENT STATS (2020.08.09)
現状のグラフ (2020.08.09)
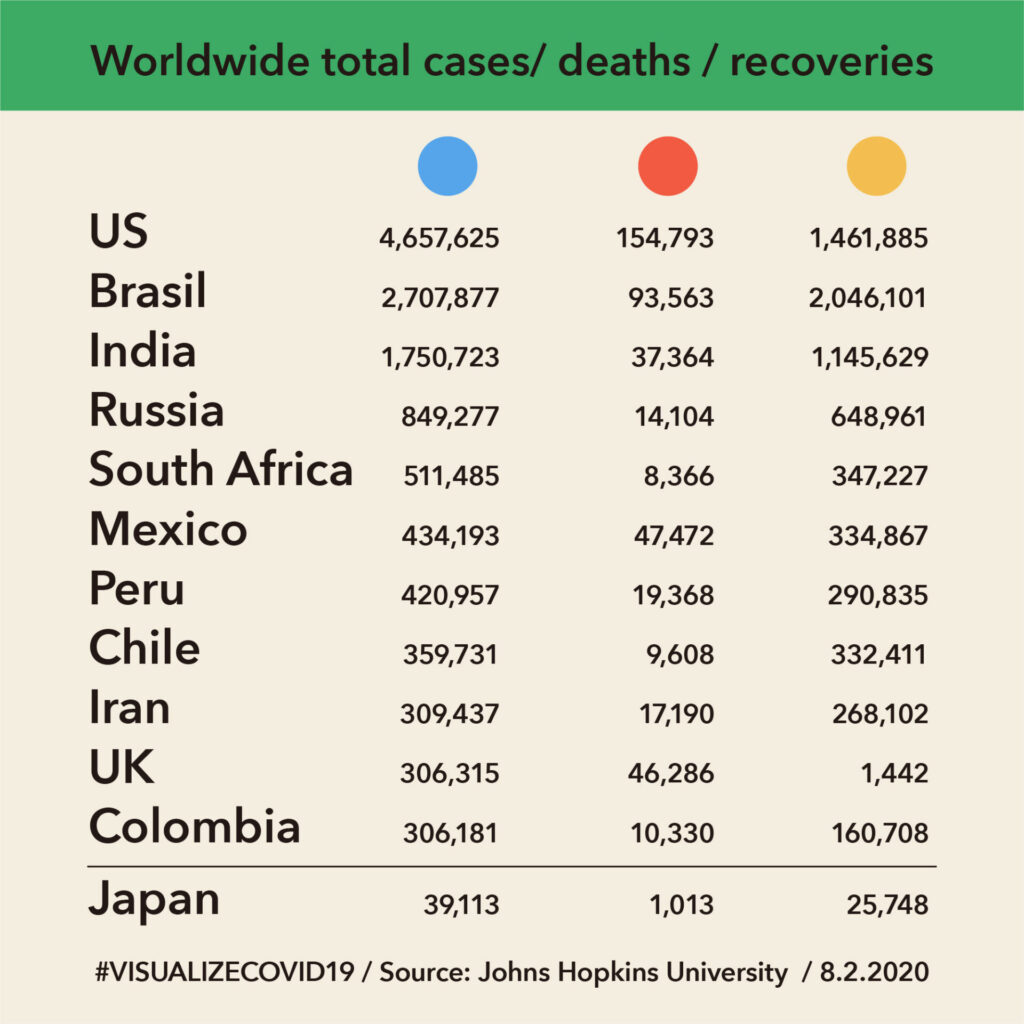
CURRENT STATS (2020.08.02)
現状のグラフ (2020.08.02)
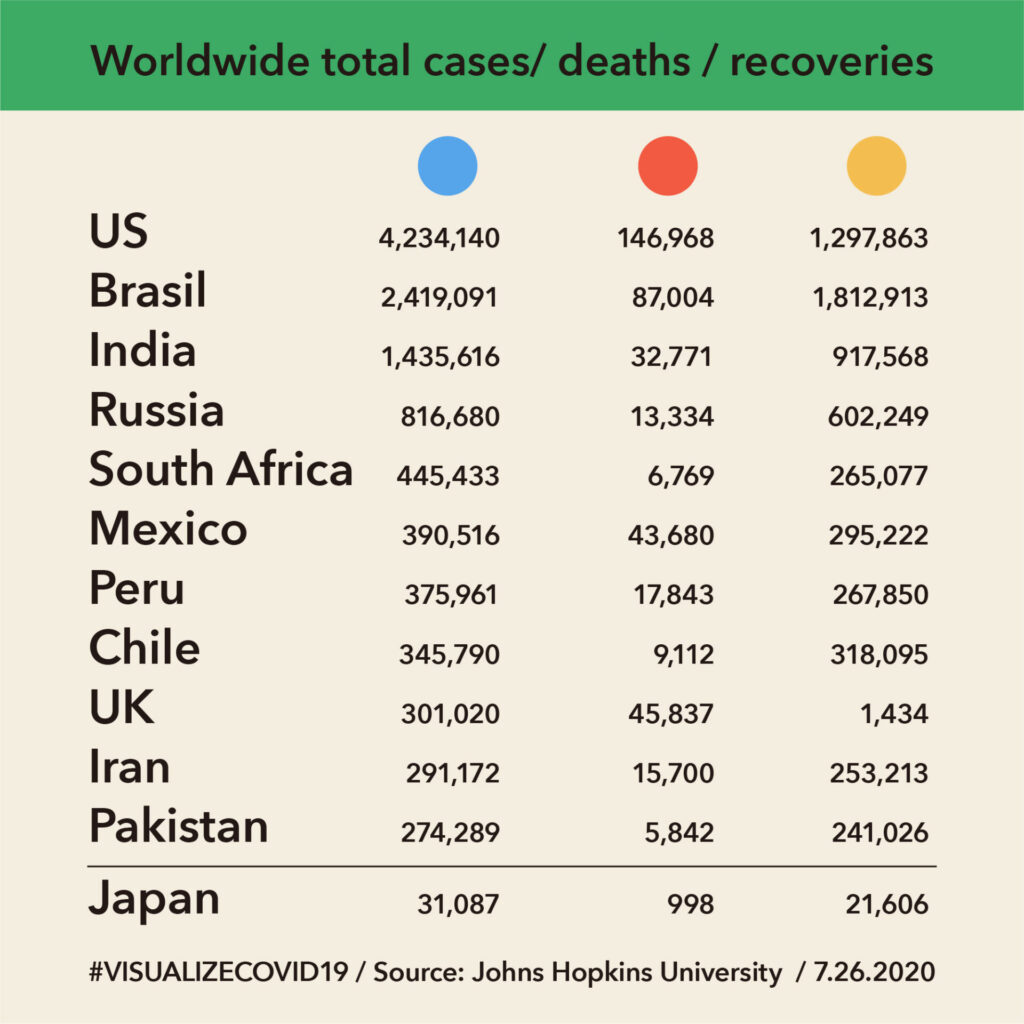
CURRENT STATS (2020.07.26)
現状のグラフ (2020.07.26)
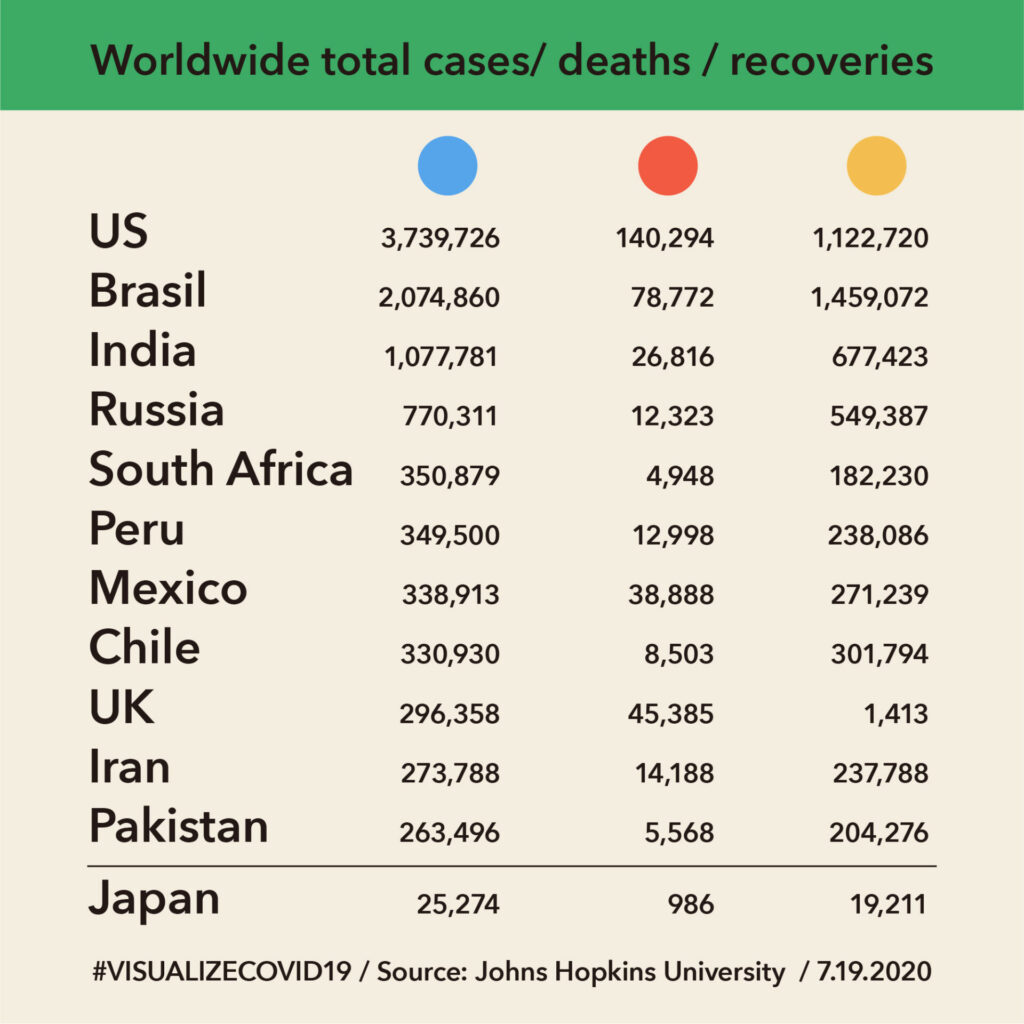
CURRENT STATS (2020.07.19)
現状のグラフ (2020.07.19)
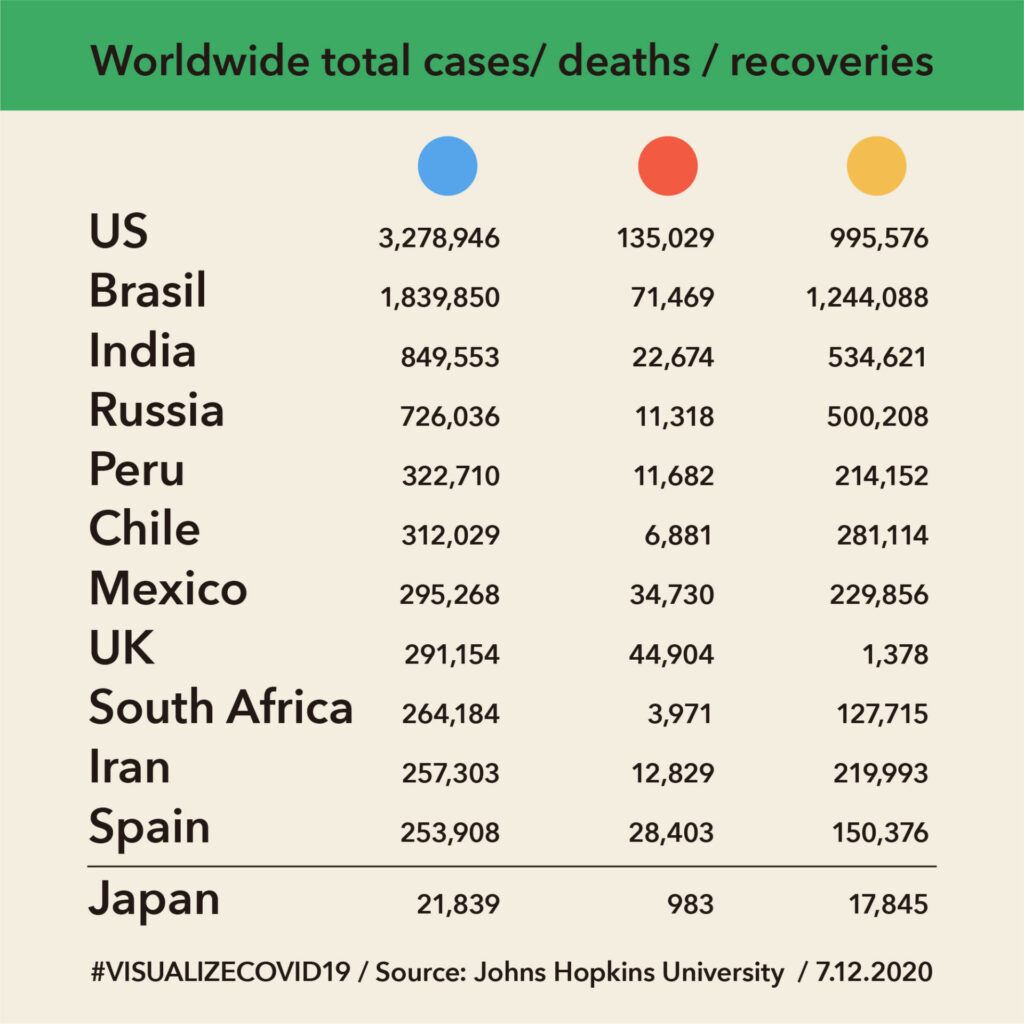
CURRENT STATS (2020.07.12)
現状のグラフ (2020.07.12)
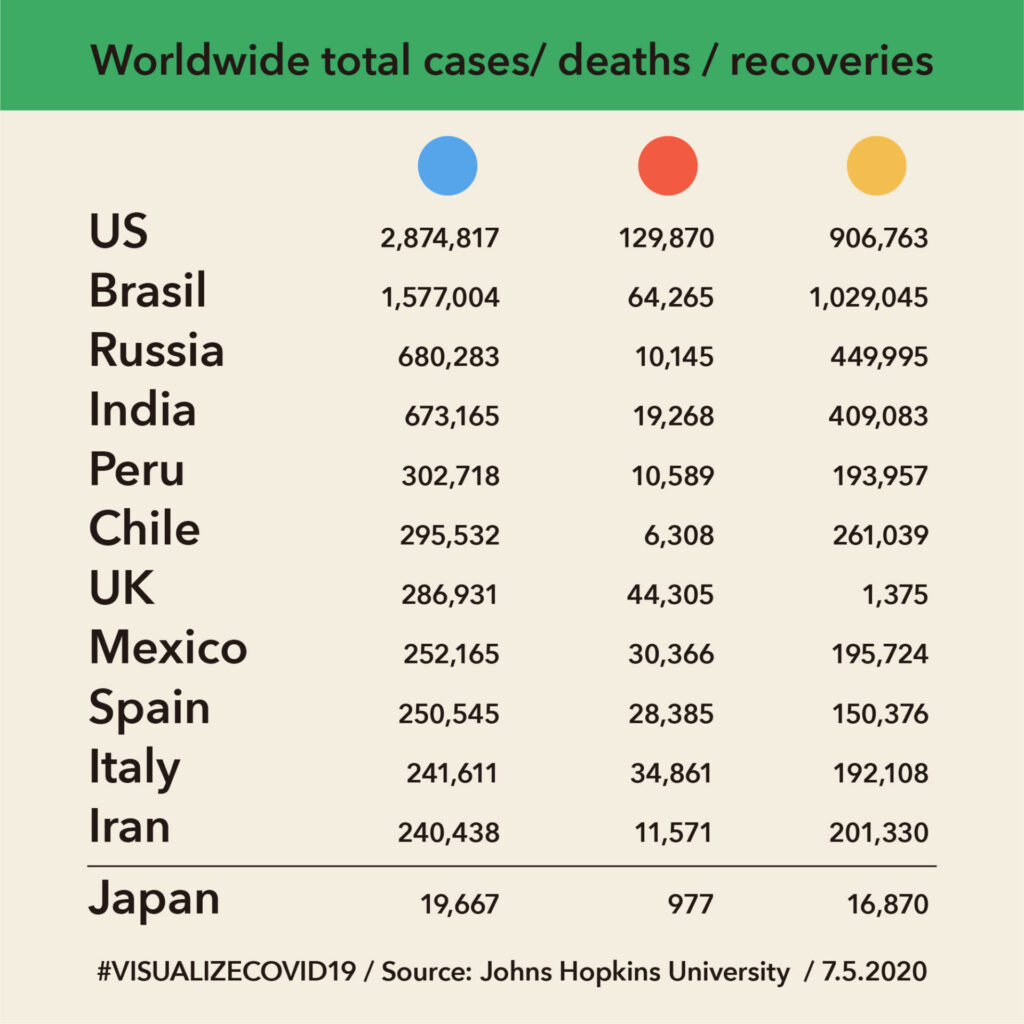
CURRENT STATS (2020.07.05)
現状のグラフ (2020.07.05)
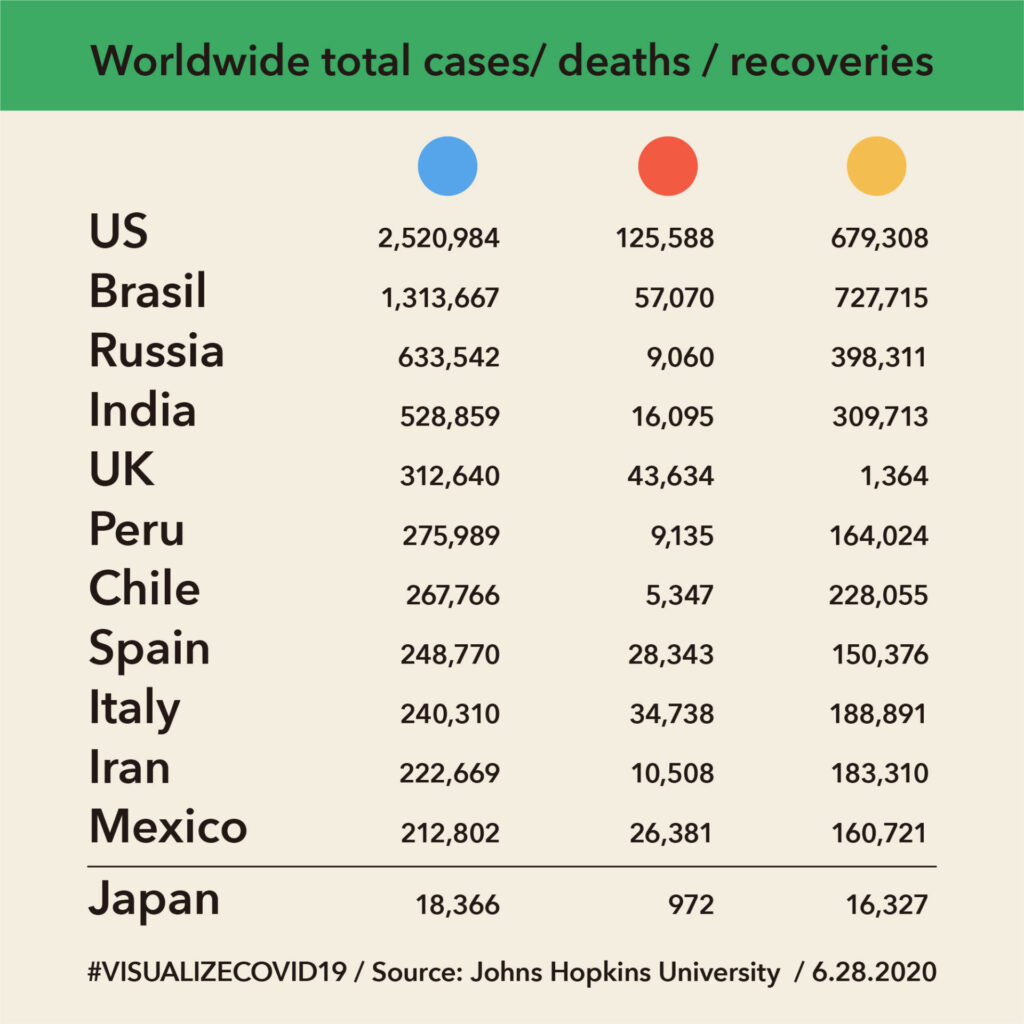
CURRENT STATS (2020.06.28)
現状のグラフ (2020.06.28)
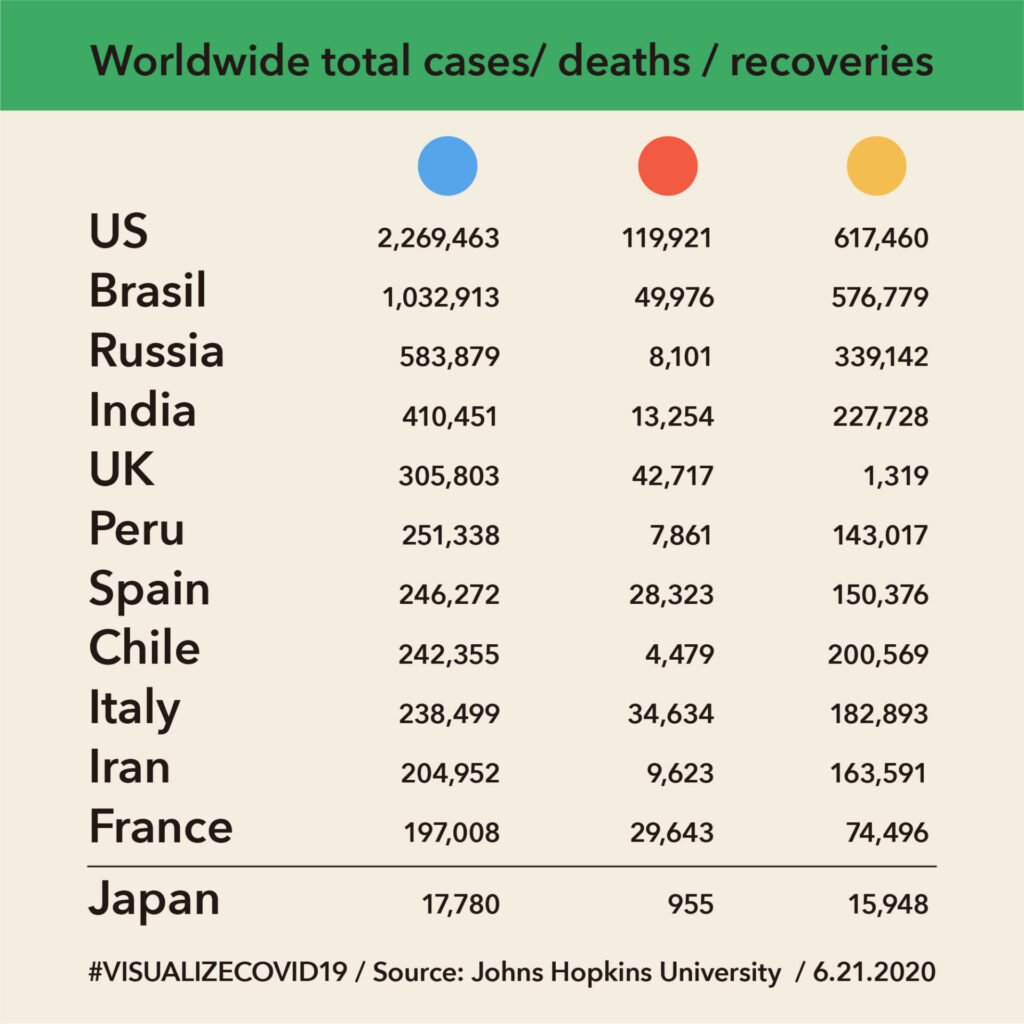
CURRENT STATS (2020.06.21)
現状のグラフ (2020.06.21)
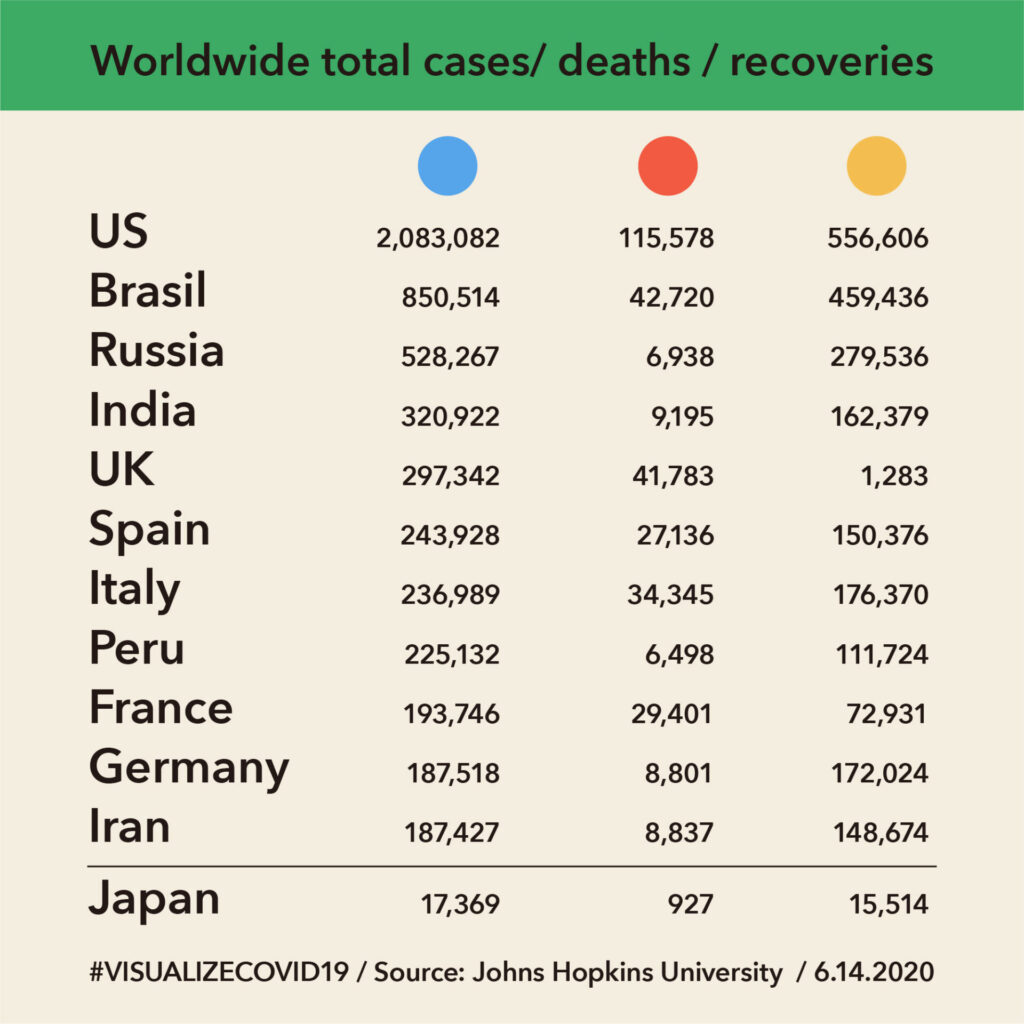
CURRENT STATS (2020.06.14)
現状のグラフ (2020.06.14)
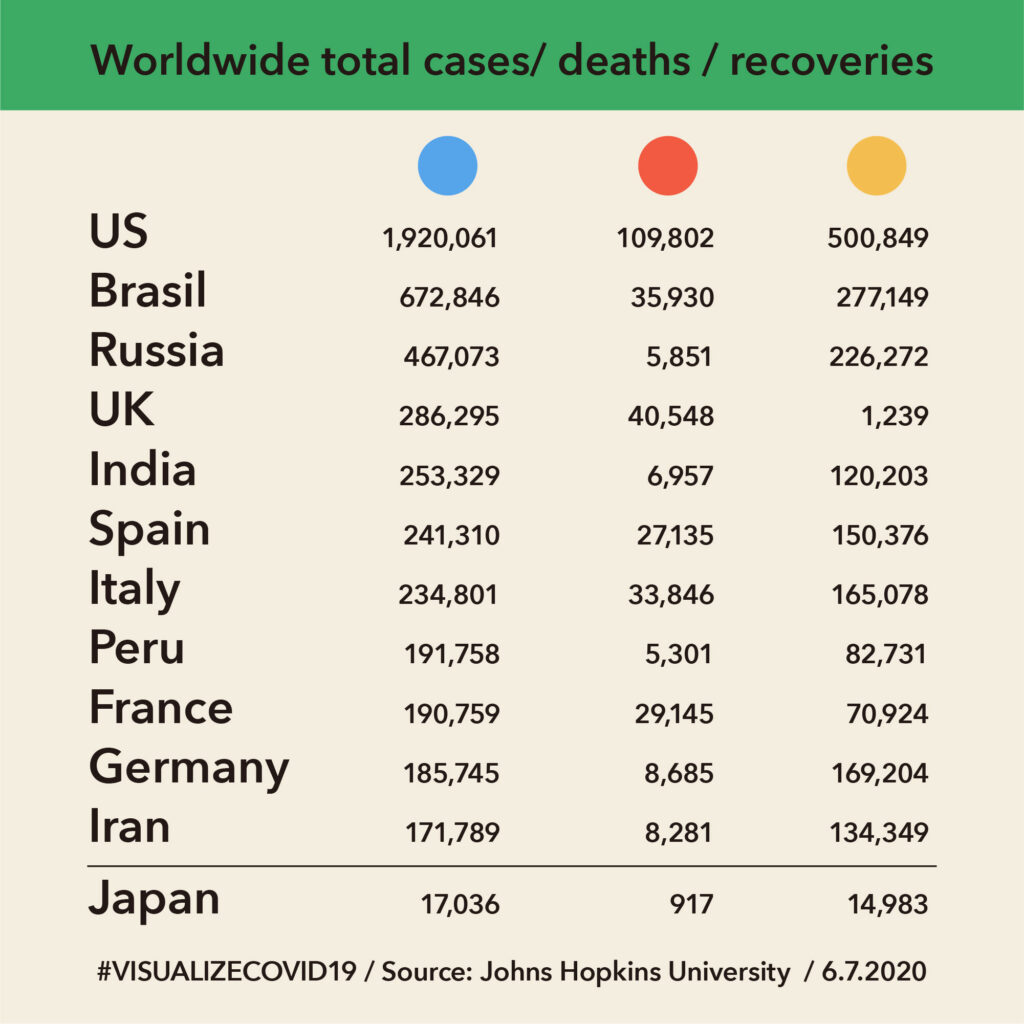
CURRENT STATS (2020.06.07)
現状のグラフ (2020.06.07)
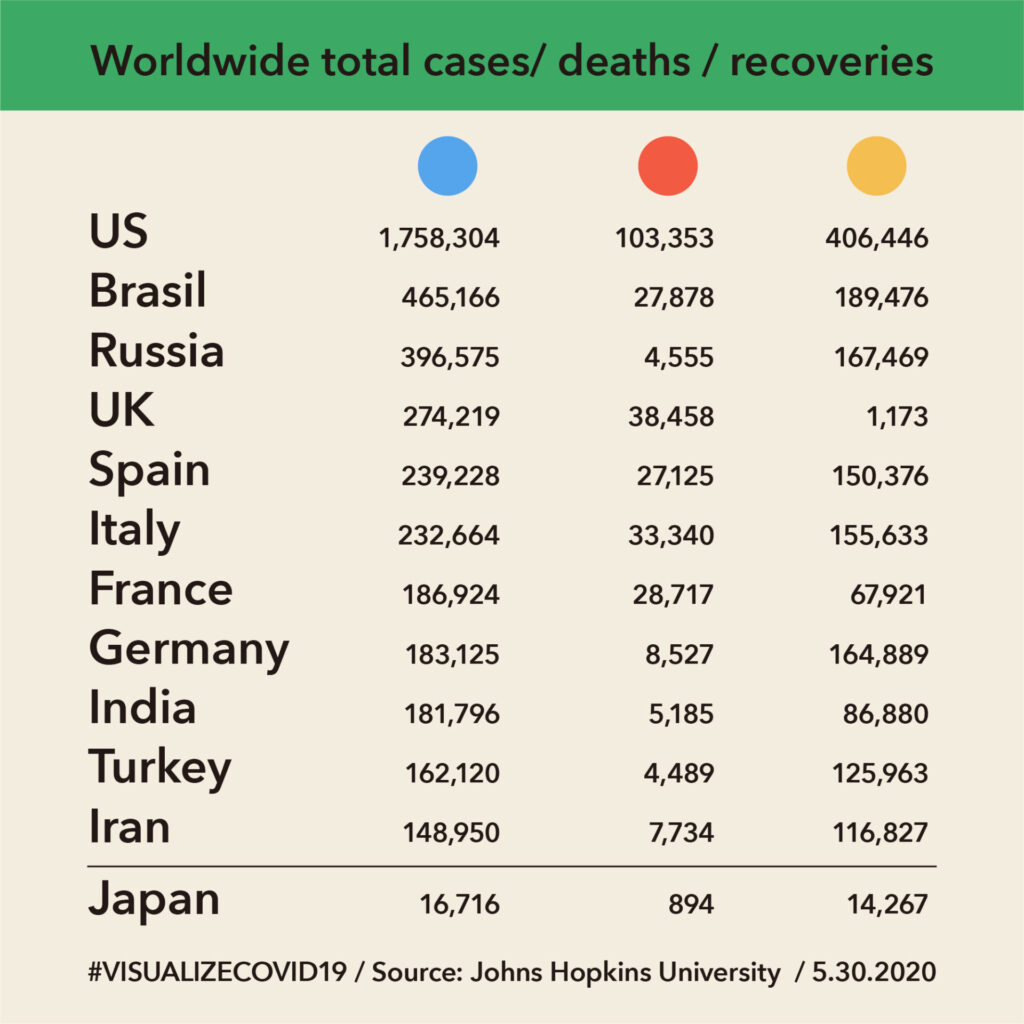
CURRENT STATS (2020.05.30)
現状のグラフ (2020.05.30)
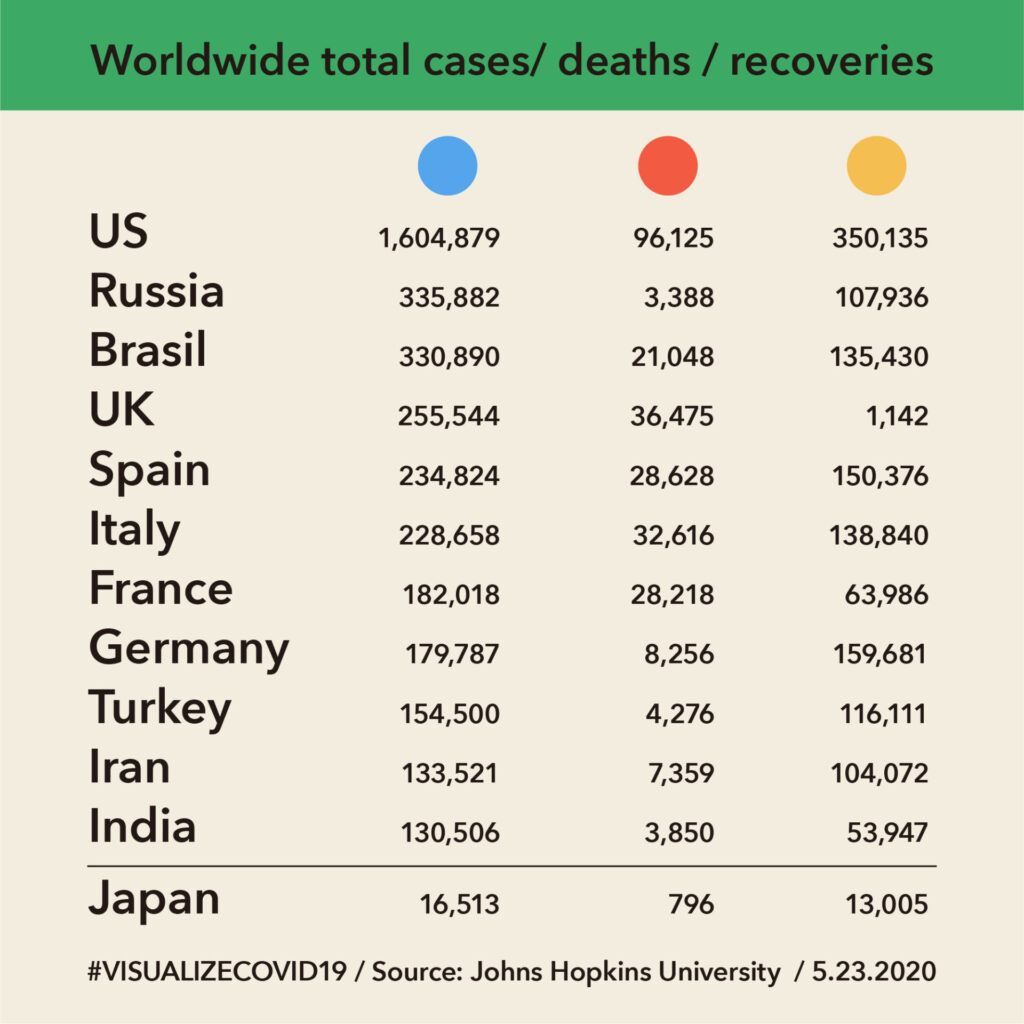
CURRENT STATS (2020.05.23)
現状のグラフ (2020.05.23)
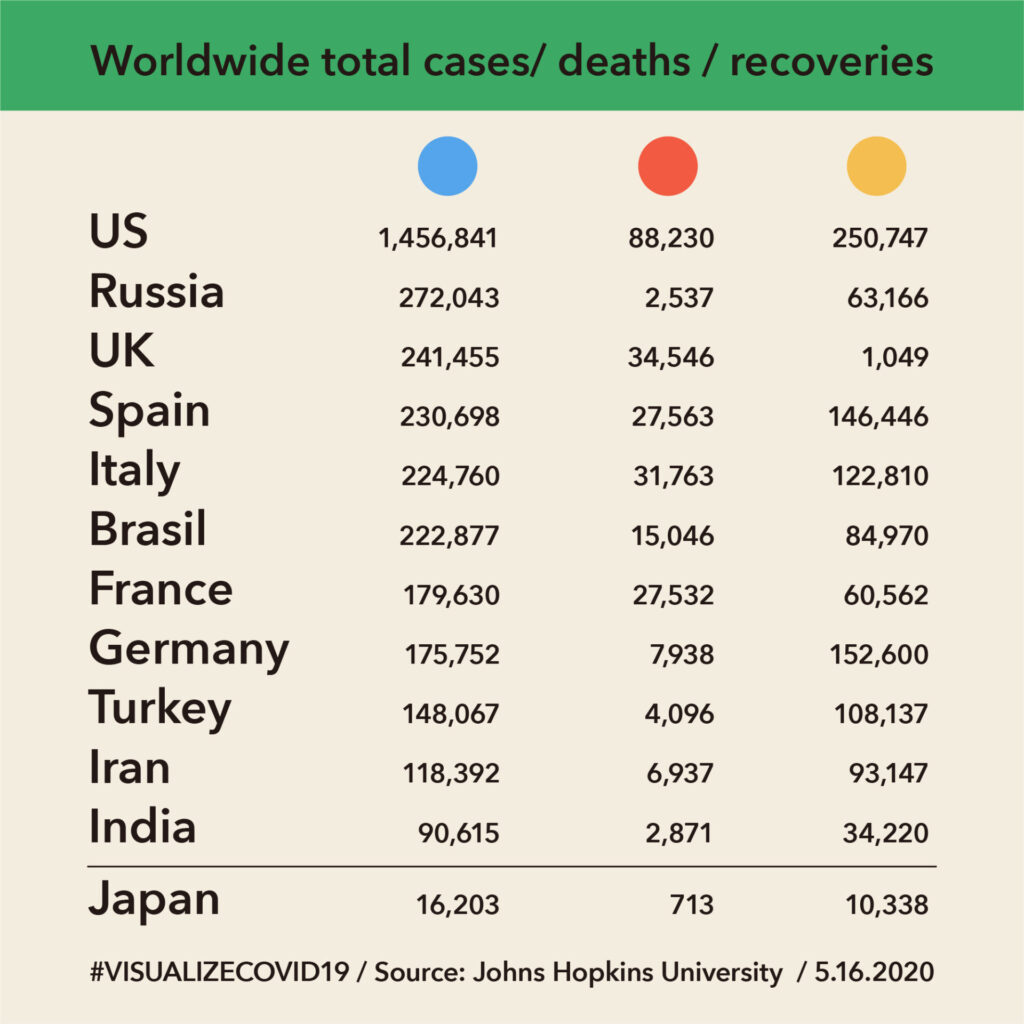
CURRENT STATS (2020.05.16)
現状のグラフ (2020.05.16)
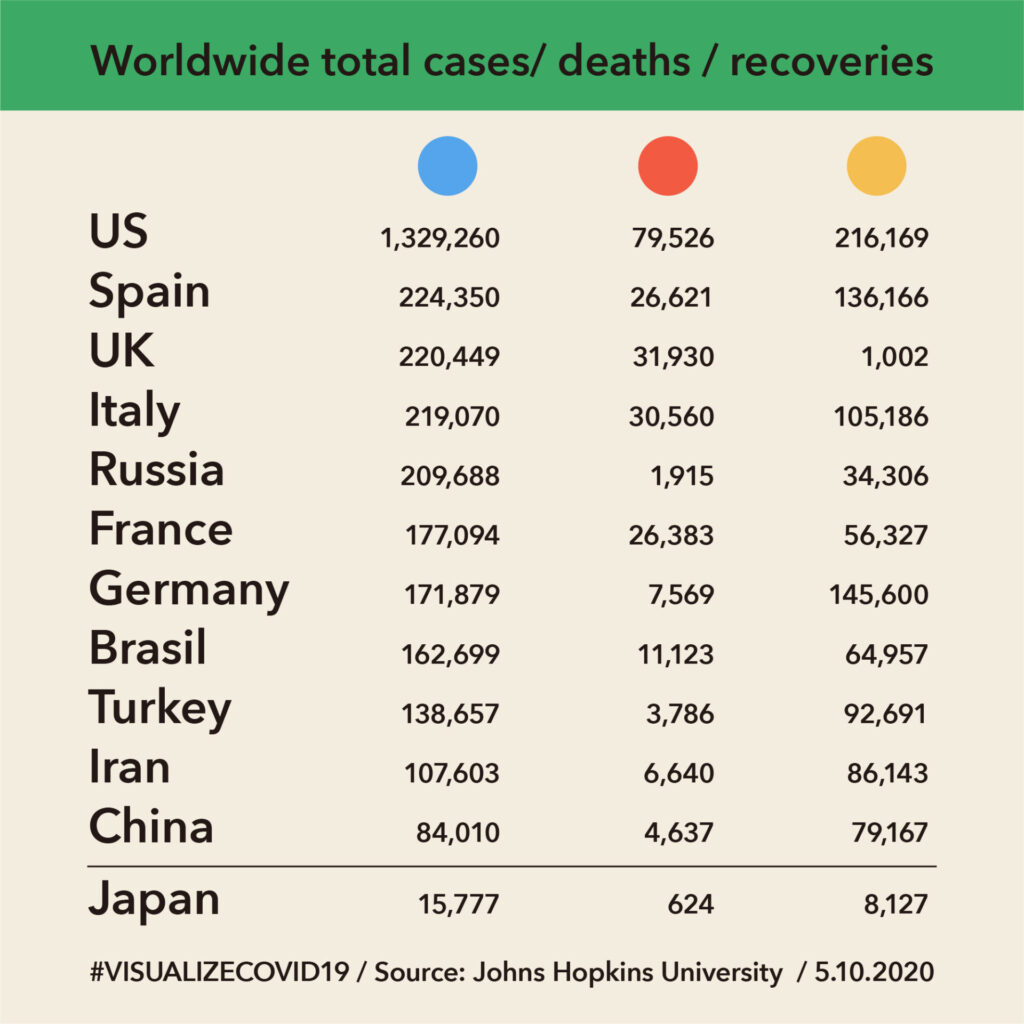
CURRENT STATS (2020.05.10)
It is now May. While it would require more time for COVID 19 to be contained, here are the stats at a glance, as of May 8th (worldwide) and 10th (by country). We are posting simple visuals to crunch the numbers, illustrating facts such as confirmed cases, deaths, and recoveries with easy-to-read graphs. By looking at numbers from multiple perspectives, we can gain a more accurate understanding of the current status worldwide.
現状のグラフ (2020.05.10)
5月になりました。COVID19が終息するにはまだ時間が必要ですが、5月8日(世界)と10日(国ごと)の、現在の状況をまとめました。数回に分けて感染者、死者数、回復者数を軸に、数字だけではわかりにくい内容をなるべくわかりやすくお伝えしています。数を単体ではなく相対的に見ることで、世界の状況が見えてきます。